"The Legend Lives On" With the 50th Anniversary of the Sinking of the Edmund Fitzgerald
/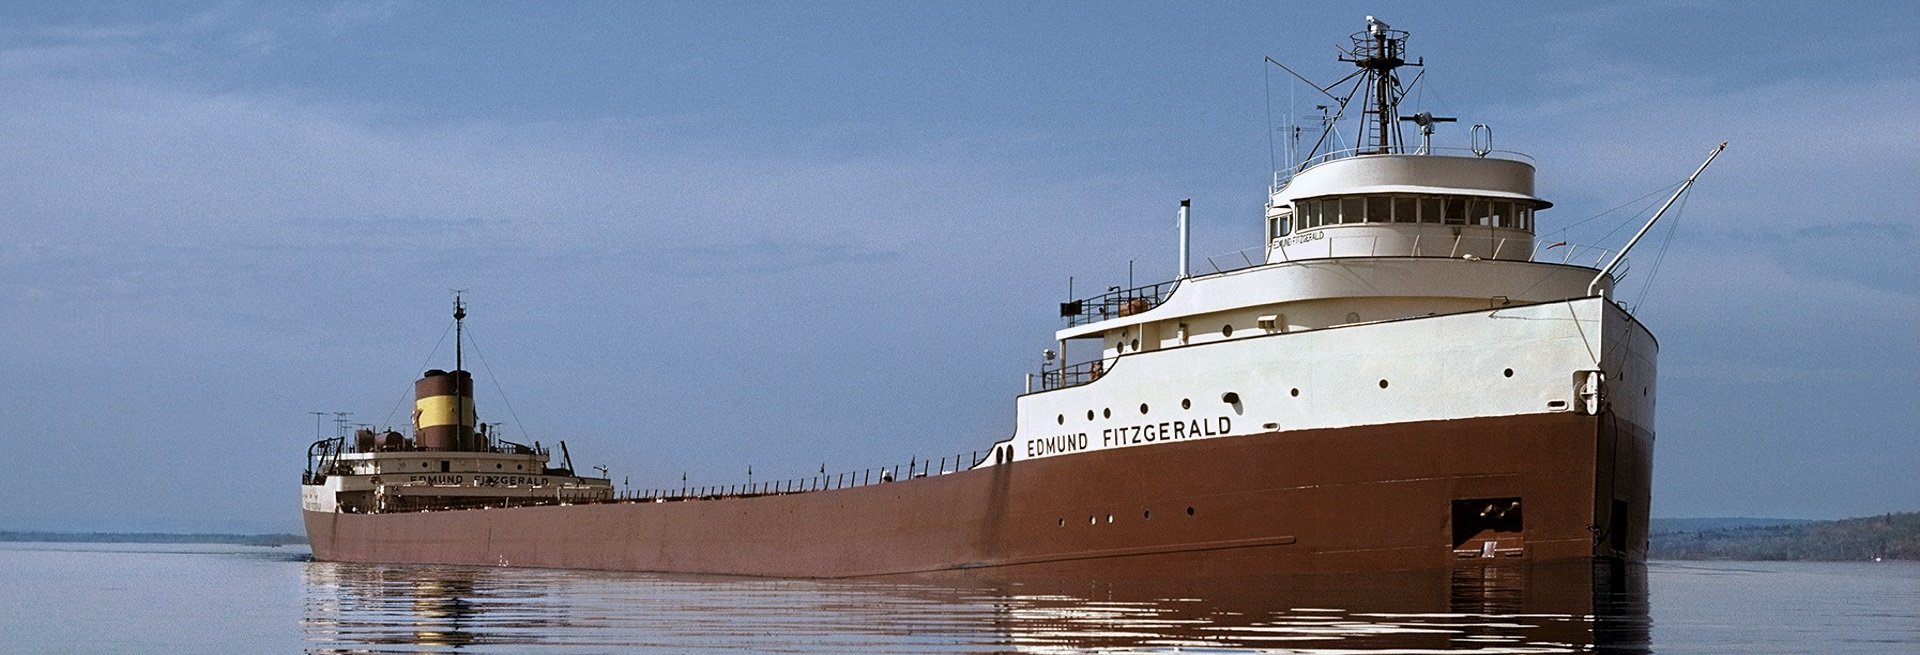
the Edmund Fitzgerald on the St. Mary’s River in 1975. Photo by Bob Campbell, courtesy of the University of Wisconsin.
Today we remember the sinking of the Edmund Fitzgerald and the loss of her 29 crew members in 1975. Many Canadians and Americans are familiar with this now infamous event thanks to a very popular song by Gordon Lightfoot from 1976, The Wreck of the Edmund Fitzgerald. The ship sank 17 miles north-northwest of Whitefish Point, just outside of Whitefish Bay, an area that is sadly full of shipwrecks. To this day, there has been no official cause behind the wreck, but the weather was a major factor.

The tracks of the Edmund Fitzgerald and the nearby Arthur M. Anderson. Image courtesy of the national weather service.
Lake Superior is known for its intense November storms, known as gales or witches, and one such storm moved through the region on November 9th and 10th of 1975, when the Edmund Fitzgerald sank.
The Edmund Fitzgerald departed from Superior, Wisconsin at about 2:30pm on November 9th and was quickly joined by the Arthur M. Anderson, which had departed out of Two Harbors, Minnesota. The Captains of the two ships were aware of an incoming storm and opted to take the safer northern route across Lake Superior to their destinations. The Edmund Fitzgerald took the lead and the Arthur M. Anderson followed at a distance of 10 to 15 miles.
The National Weather Service issued a gale warning at 7pm on November 9th, which was then upgraded to a storm warning in the early morning hours of November 10th. By the early afternoon, winds were gusting at 50 knots (93 km/h) and waves were 3.5 to 5 metres (12 to 16 feet) tall, but these were conditions that the Captains could handle.
The conditions continued to deteriorate throughout the afternoon and at 3:30pm, Captain McSorley of the Edmund Fitzgerald radioed the Arthur M. Anderson to report minor damage to the ship along with a list (a tilt). He asked the other ship to stay close until they got to Whitefish Bay, at the eastern end of Lake Superior, and he would slow down so they could follow closer. Captain Cooper of the Arthur M. Anderson agreed and the two ships continued on their journey.
Reports from the Arthur M. Anderson give us the best insight to the conditions the two ships faced heading into the evening. At approximately 5:20pm, Captain Cooper reported sustained winds of 58 knots (107 km/h) and gusts of 70 knots (130 km/h) along with waves of 5.5 to 7.5 metres (18 to 25 feet). Then, at about 6:55pm, the crew felt a “bump” and the ship lurched due to a gigantic wave crashing into the ship from behind, forcing the bow under water. Just as the ship recovered, a second wave hit. Captain Cooper later said that he watched those two waves head towards the Edmund Fitzgerald ahead of them and he believed that those two waves sank her.
The Arthur M. Anderson made its final contact with the Edmund Fitzgerald at 7:10pm to confirm their position. They were having trouble tracking the lead ship because the waves were so high that they were interfering with radar. The ship kept disappearing and reappearing on radar, but at 7:15pm, it disappeared for the last time. The Arthur M. Anderson tried to contact the Edmund Fitzgerald once again at 7:22pm, but there was no answer. The Edmund Fitzgerald was not seen again until May 20th, 1976, 163 metres (535 feet) below the surface of the lake.

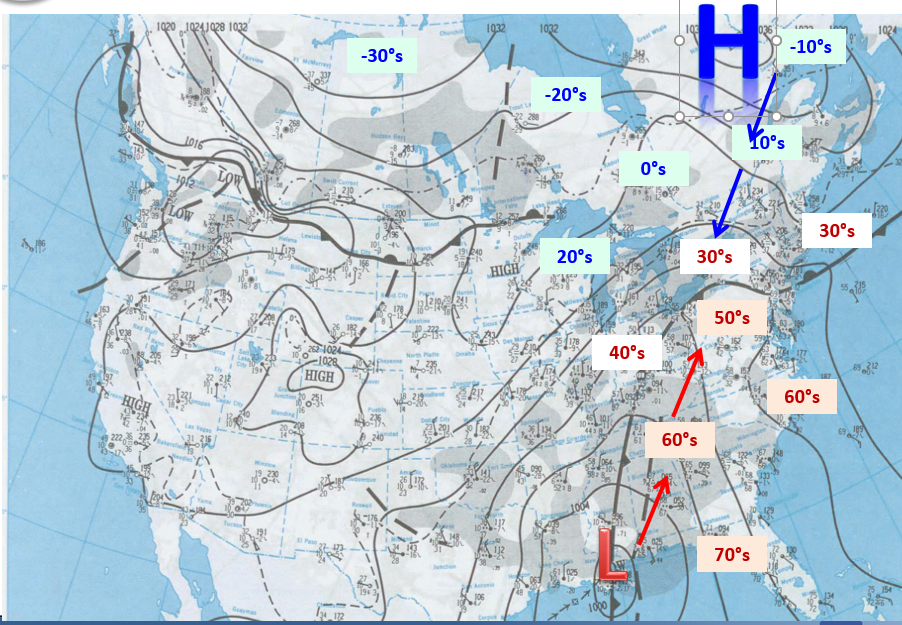
Modelled wave heights and directions on lake superior at 7pm, November 10th, 1975. The location of the Edmund Fitzgerald wreck is marked by the red plus. Image Courtesy of the National Weather Service.
In 2006, a study re-examined the November 1975 storm using modern computer modelling in order to determine wind strength and wave heights at the time of the sinking. According to these models, it’s likely that the waves were at least 7.5 metres (25 feet) tall driven by sustained winds over 45 knots (83 km/h). Unfortunately, the worst conditions from this storm occurred exactly when and where the Edmund Fitzgerald sank.
Three months after the discovery of the doomed ship, Gordon Lightfoot released his hit song, The Wreck of the Edmund Fitzgerald, which has forever memorialized the ship into the hearts and minds of Canadians and Americans alike. The anniversary of the sinking is still honoured every year at the Great Lakes Shipwreck Museum at Whitefish Point. In the ceremony, the recovered bell of the Edmund Fitzgerald is rung 29 times, for each crew member lost, and a 30th time for all others who have been lost to the Great Lakes.
Further Reading:
Hultquist, T.R., Dutter, M.R. and Schwab, D.J. (2006). Reexamination of the 9–10 November 1975 “Edmund Fitzgerald” Storm Using Today's Technology. Bulletin of the American Meteorological Society, 87(5), 607-622. https://doi.org/10.1175/BAMS-87-5-607
https://www.shipwreckmuseum.com/edmund-fitzgerald/
https://www.shipwreckmuseum.com/the-fateful-journey/
https://www.ssedmundfitzgerald.org/storm-and-voyage
https://www.weather.gov/mqt/fitz_fitz